August 2026 GTA Market Watch: Where Did All The Listings Go?
The August 2026 GTA real estate market delivered an interesting shift. Sales didn’t suddenly take off. Prices
didn’t surge. The big change was inventory.
Fewer sellers are bringing homes to market, and the total number of homes available for sale has also fallen compared
with last year. That could eventually change the balance between buyers and sellers—but we’re not there
across the GTA just yet.
More importantly, once you look beyond the GTA-wide averages, August shows just how different conditions can be from
one community to the next.
Monthly Market Outlook Video
August 2026 GTA Real Estate Market Activity
Let’s start with the big picture.
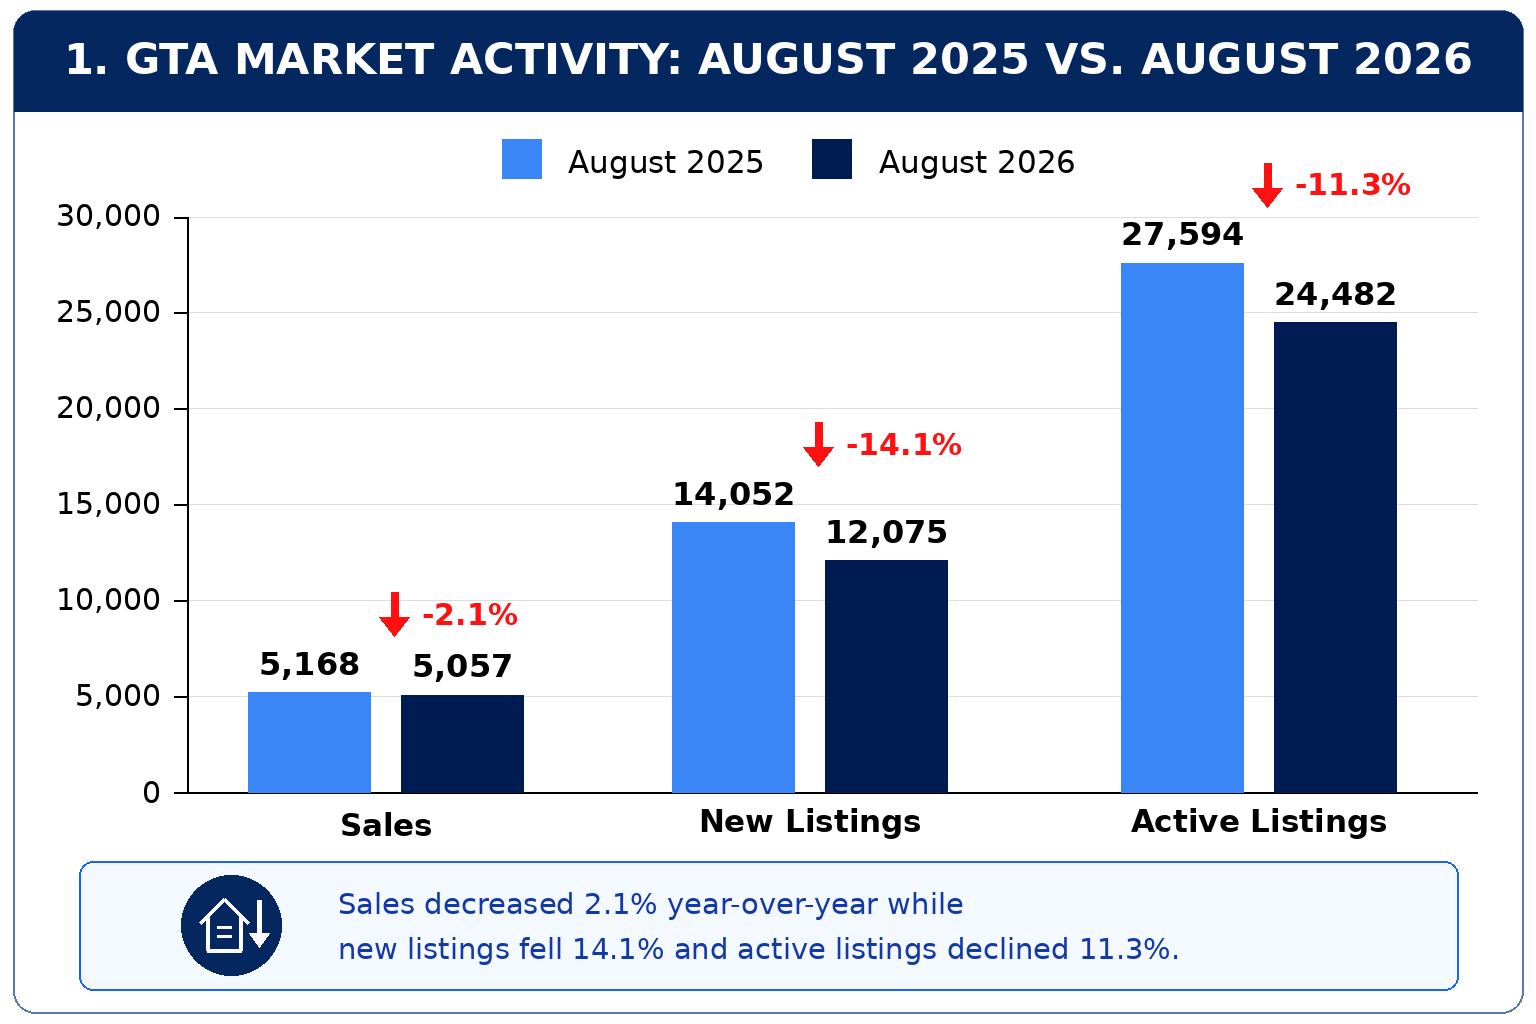
There were 5,057 GTA home sales in August 2026, compared with 5,168 in August 2025. That represents
a relatively modest 2.1% year-over-year decline.
What stands out is what happened on the supply side.
New listings fell 14.1% year-over-year to 12,075, while active listings dropped 11.3% to 24,482.
That gap is important. Buyers didn’t come charging back into the market. Instead, the number of sellers
bringing homes to market declined much faster than sales.
And it isn’t only new listings that are falling. Active inventory—the total pool of homes available for
buyers to purchase—has also declined.
So the pipeline is shrinking, and now the pool is shrinking too.
GTA Home Prices Remain Below Last Year
Less inventory might sound like an immediate recipe for rising prices, but August’s pricing data tells us not
to get ahead of ourselves.
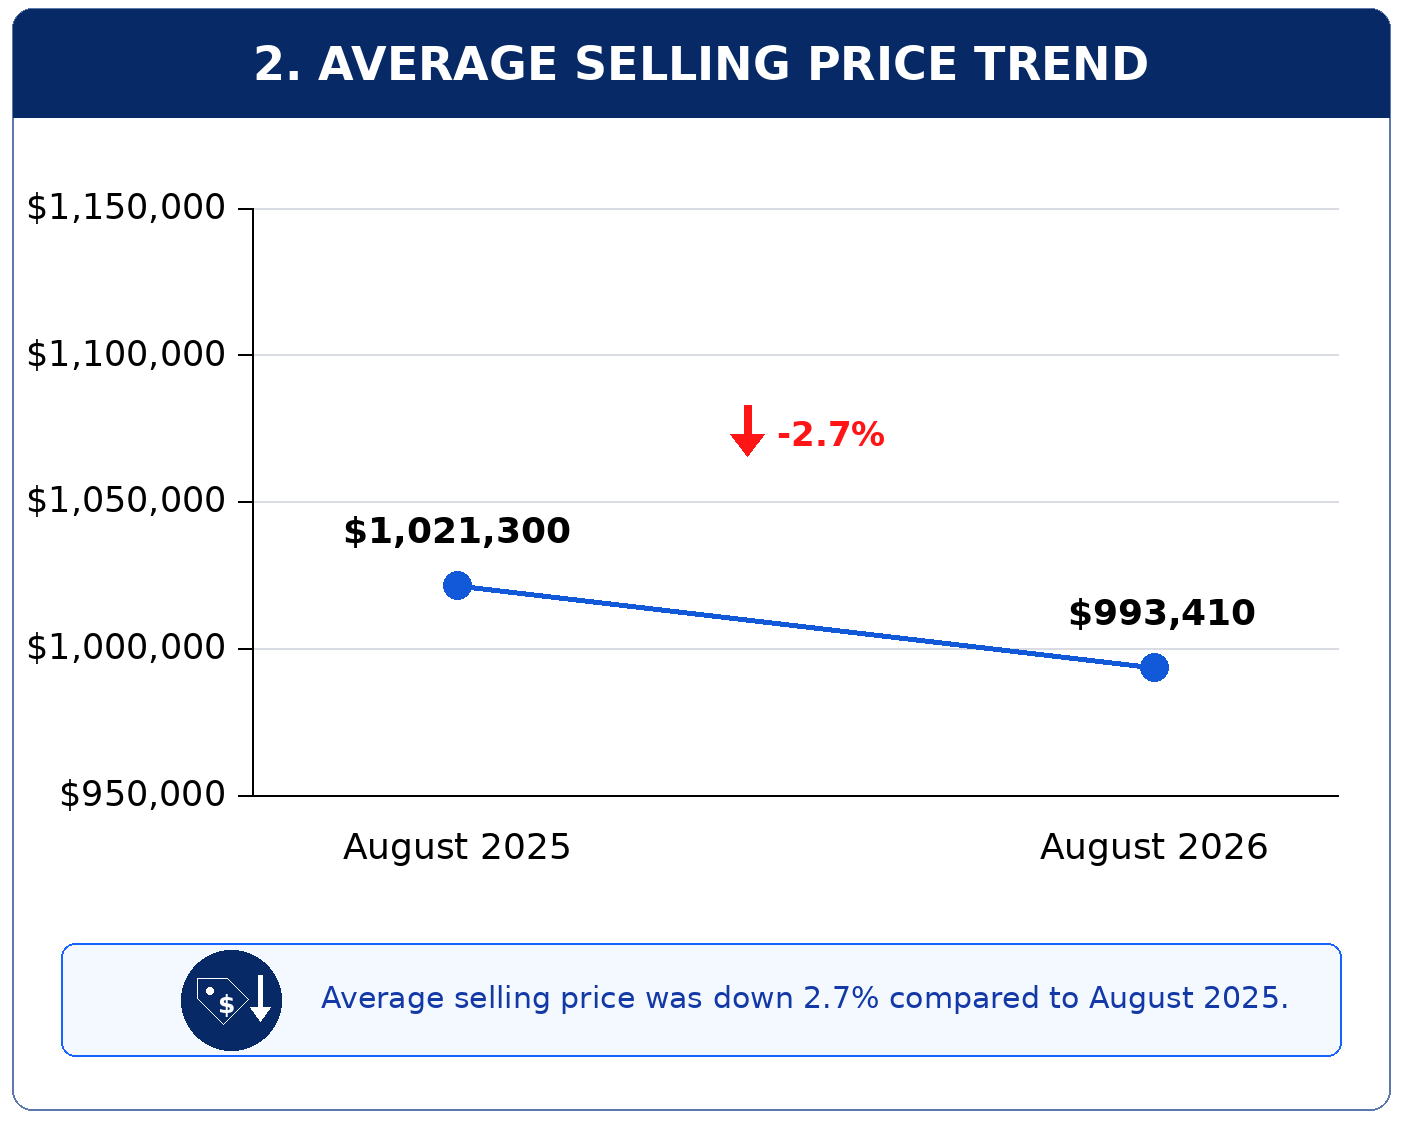
The average GTA selling price was $993,410, down 2.7% from $1,021,300 in August 2025.
The MLS® Home Price Index Composite benchmark was also down 4.5% year-over-year.
So yes, inventory is tightening compared with last year. But prices remain below last year’s levels.
TRREB noted that less choice and increased competition between buyers could eventually contribute to renewed
price growth if inventory continues to tighten. That is something to watch rather than a declaration that prices are
suddenly taking off.
August 2026 GTA Prices by Property Type
The average price also varied considerably depending on what type of home you were looking at.
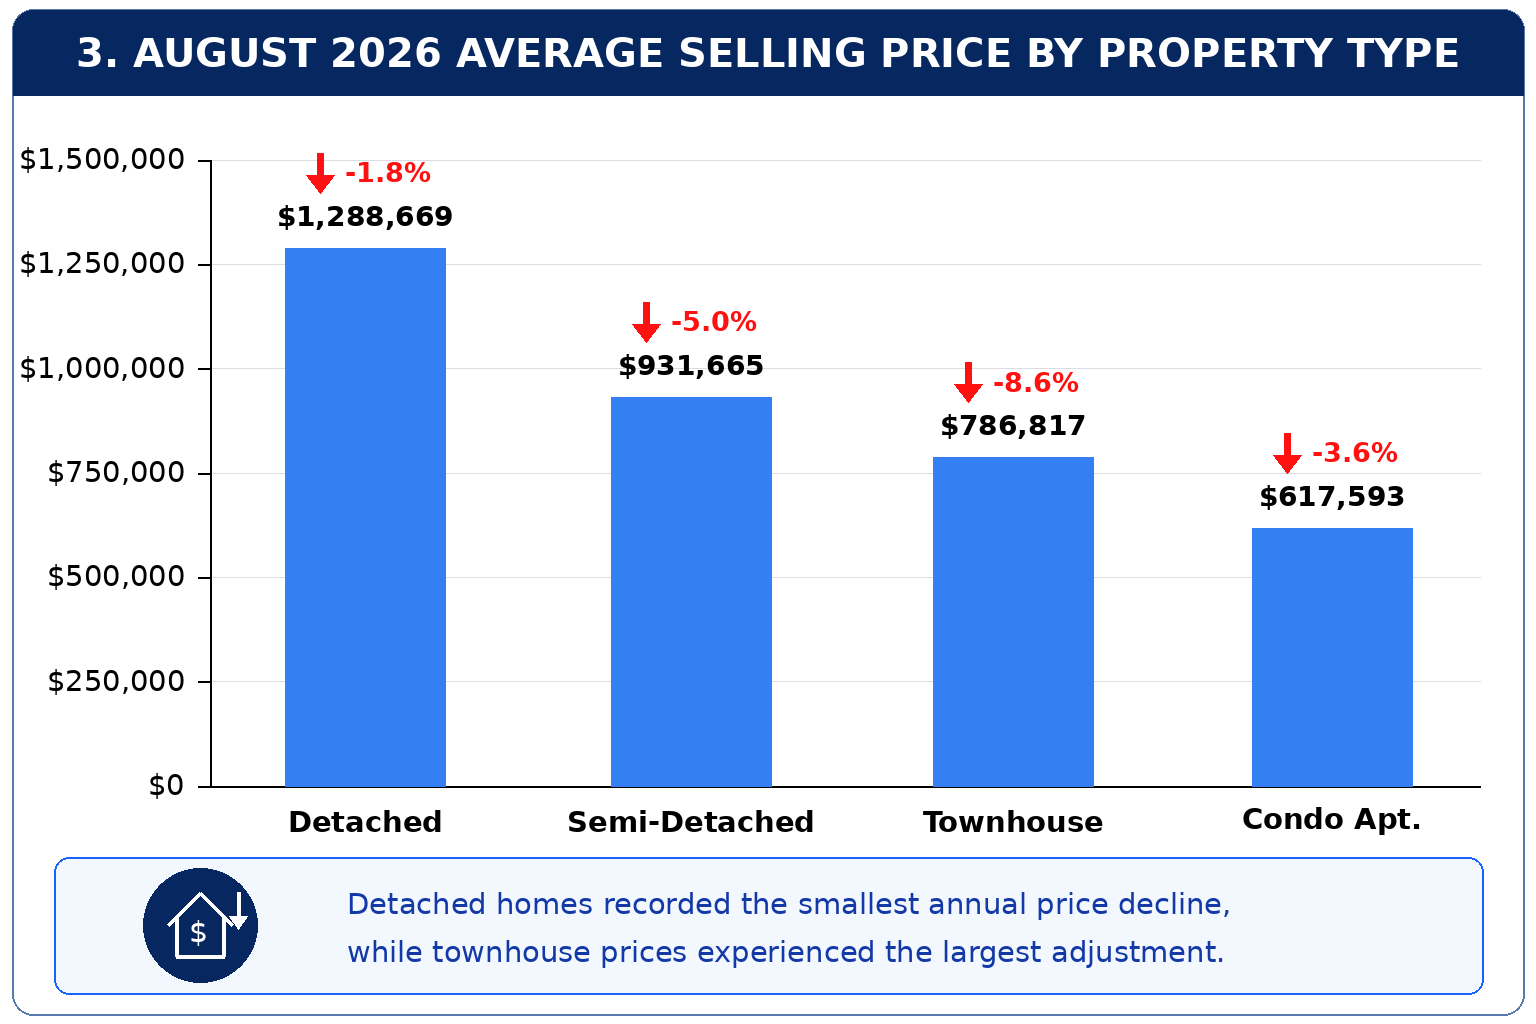
In August, detached homes recorded an average selling price of $1,288,669, followed by semi-detached
homes at $931,665, townhouses at $786,817 and condo apartments at
$617,593.
All four categories were below their August 2025 average prices.
Detached homes saw the smallest annual decline of the four at 1.8%. Semi-detached prices were down 5.0%, condo
apartments were down 3.6%, and townhouses recorded the largest decline at 8.6%.
That alone is a good reminder that even a GTA-wide average price can’t tell you what is happening with the
particular type of home you own or want to buy.
The Bigger August Story Is Inventory
To understand why inventory matters, it helps to look at the relationship between sales and listings.
Across the GTA, August recorded 5,057 sales against 12,075 new listings. That works out to roughly 42 sales for every
100 new listings.
That relationship has tightened compared with August of last year, when it was closer to 37 sales for every 100 new
listings.
But that does not mean every GTA neighbourhood has suddenly become competitive.
In fact, another inventory measure complicates the story. GTA months of inventory increased from roughly 4.4 months
in July to approximately 4.8 months in August.
Months of inventory estimates how long it would take to sell the available inventory at the current pace of sales. So
while year-over-year active inventory is falling, August’s slower sales pace meant months of inventory moved
slightly higher.
That’s exactly why one statistic rarely tells the whole story.
There Really Isn’t One GTA Housing Market
This is where the August numbers get particularly interesting.
Looking specifically at detached homes, inventory conditions varied dramatically across the region.
Among the tighter detached markets were Toronto East, Markham, Newmarket, Burlington and Whitby. Burlington and
Whitby were both sitting at approximately three months of detached inventory.
Whitby, for example, recorded 82 detached sales in August against 246 active detached listings.
Now compare that with some of the GTA’s higher-inventory detached markets.
Stouffville: approximately 6.4 months of inventory
Richmond Hill: more than 7 months
Georgina: approximately 7.6 months
Innisfil: approximately 7.8 months
Caledon: approximately 7.8 months
Richmond Hill is particularly notable because this wasn’t based on a tiny number of transactions. There were 74
detached sales and 518 active detached listings.
Caledon recorded 49 detached sales against 382 active listings.
A detached buyer facing roughly three months of inventory is having a very different experience from one looking at a
market approaching eight months.
Brampton vs. Caledon Shows Why Local Data Matters
One comparison sums up the August market particularly well.
Brampton and Caledon are both in Peel Region, yet their detached markets looked completely different.
Brampton had roughly four months of detached inventory. Caledon was approaching eight
months.
For a buyer, that difference can affect how much choice is available. For a seller, it can change the amount of
competition your home faces when it hits the market.
It’s also why pricing a property based only on a GTA headline—or even a regional average—can give
you an incomplete picture.
Don’t buy the market. Buy the property and the neighbourhood.
The same principle applies when you’re selling.
What Does the August 2026 GTA Market Mean for You?
August gave us some evidence that GTA housing inventory is tightening compared with last year, but it did not
suddenly turn the entire region into a seller’s market.
There were still 24,482 homes available for sale across the GTA, while both the average selling price and benchmark
price remained below August 2025 levels.
The more useful question for buyers and sellers right now isn’t simply, “Is the GTA market going up or
down?”
It’s: What is happening with inventory for my property type, neighbourhood and price range?
Because August showed us that one GTA community can offer buyers considerable choice while another can already feel
much tighter.
The GTA average gives us the headline. Your local numbers tell you what that headline actually means for you.
Want to understand what the August numbers mean for your neighbourhood or the
area you're considering?